Dashboard
The Load Balancer provides a Dashboard for real-time monitoring and management of your Worker cluster.
Features
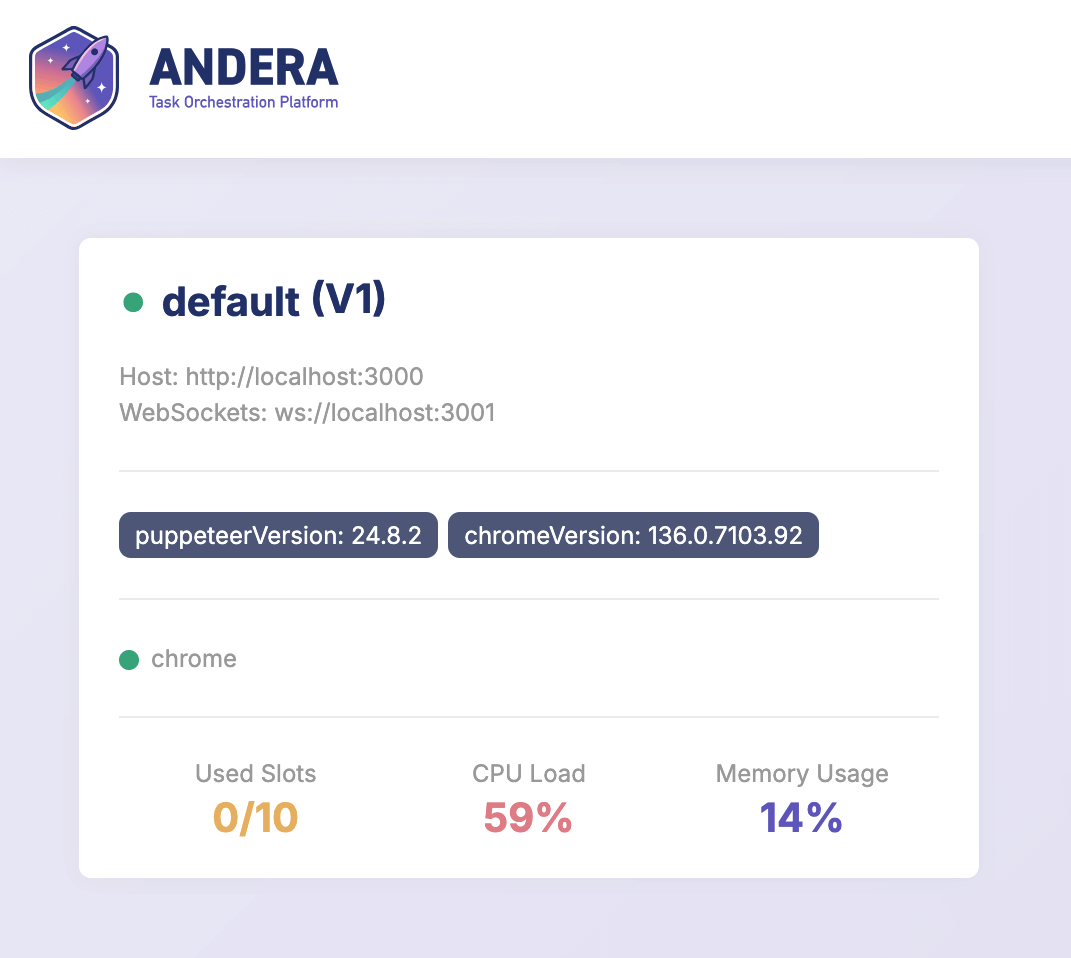
- Lists all connected Workers and their status.
- Displays Worker details (group, contract, slots, servies, tags).
- Shows logs from each Worker (fetched from their
/logsendpoint).
Access
- The dashboard is available at
/dashboardif enabled in the configuration. - This interface requires authentication and SSL, which must be handled by an HTTP proxy configured by the administrator.
Example Nginx Proxy Configuration
location /dashboard/ {
  proxy_pass http://localhost:3000/dashboard/;
  auth_basic "Restricted";
  auth_basic_user_file /etc/nginx/.htpasswd;
  # SSL configuration here
}
Monitoring Workers
- The dashboard fetches Worker information from their
/healthand/logsendpoints. - Tags and other metadata are displayed for each Worker.
- Use the dashboard to monitor cluster health, task queues, and debug issues in real time.
Enabling or Disabling the Dashboard
The dashboard interface can be enabled or disabled using the DASHBOARD_ENABLED environment variable in your Load Balancer configuration. Set it to true to enable or false to disable the dashboard:
DASHBOARD_ENABLED=true
By default, the dashboard is enabled. If you do not want to expose the dashboard, set this variable to false.